Communicatng Risk
In medicine, when we talk about risks we are usually talking about probabilities. Probability is the chance or likelihood that a particular event will occur. The likelihood of something occurring is often expressed as a
- percentage (%)
- natural frequency (e.g. 1 in X).
Words v Numbers
Peoples’ perceptions of risk vary, are subject to lots of biases and are affected by different things such as context.
Consider if someone said to you there is a very high risk of rain today. What would you take to mean from this?
- 25% risk of rain
- 50% risk of rain
- 75% risk of rain
- 100% risk of rain
Now consider someone said to you have a very high risk of fracture. What would your answer be now?
- 25% risk of fracture
- 50% risk of fracture
- 75% risk of fracture
- 100% risk of fracture
Was your answer to both questions the same?
If not, why not? Did you use your specialist knowledge?
How do you think a patient might interpret ‘very high risk of fracture’?
Everyone interprets risk differently.
Click on to arrows to see these 4 people who have all been told they are at high fracture risk
In addition to people having a different perspective on risk, people also interpret the words used to describe risk differently. Some people will interpret low risk or rare as 1 in 100, others as 1 in 10. For this reason it is not recommended to use words alone when explaining risk.
Some people may also find pictures helpful to understand risk. Later in this section, we will discuss Cates plots or icon arrays that are visual ways of communicating risk.
Percentages and Numbers
Question
Fracture risk is usually expressed as percentage (%) risk over a 10 year period. This is called an absolute risk.
Consider someone with a 20% 10 year risk of fracture. This could be interpreted in more than one way.
Which one is correct?
Understanding percentages requires basic numeracy skills. However, 61% of the UK population lack skills to understand current health materials containing text and numbers.
Simple frequencies, e.g. 1 in x, are easier to understand than percentages.
So in this case we can say instead
Over 10 years, if there were 100 people like you, 20 of those 100 people would have an osteoporotic fracture
Clinician
Framing Risk
Framing means you present the risk of something happening and not happening. This is less likely to lead to bias, and over focus on either the negative or positive outcome. So for instance, if you say
1 in 1000 people who take bisphosphonates will experience an unusual thigh bone break
You also say
That means 999 in 1000 people who take bisphosphonates will NOT experience an unusual thigh bone break
Relative Risk
So far we have considered absolute risk – the actual risk of an event happening. Now we will consider relative risk. Let’s look at this example.
Newspaper headline: HRT doubles risk of breast cancer

Question
So for the people that take HRT, What does this mean?
So, if this headline is correct
And assuming a baseline absolute risk of getting breast cancer of 1 in 50 over a given time
This means, that if 50 women took HRT, 2 women would develop breast cancer i.e. one additional woman would develop breast cancer per 50 treated.
Let’s compare this with a rarer event.
Newspaper headline: Bisphosphonates double risk of Osteonecrosis of the Jaw

And assuming a baseline absolute risk of getting osteonecrosis of the jaw of 1 in 500 over a given time.
This means, that if 500 people took bisphosphonates, 2 people would develop osteonecrosis of the jaw i.e. one additional person would develop osteonecrosis of the jaw per 500 treated.
Clinicians often use relative risk when they are talking about treatment benefits.
Relative risk can overestimate the benefits
Question
What does this mean for a patient taking a bisphosphonate?
Let’s apply this to bisphosphonates. Commonly, bisphosphonates are cited as halving fracture risk
Watch the video below by David Spiegelhalter (Professor of the Public Understanding of Risk). This video explains absolute and relative risk, and why relative risks are misleading.
Using Cates Plots
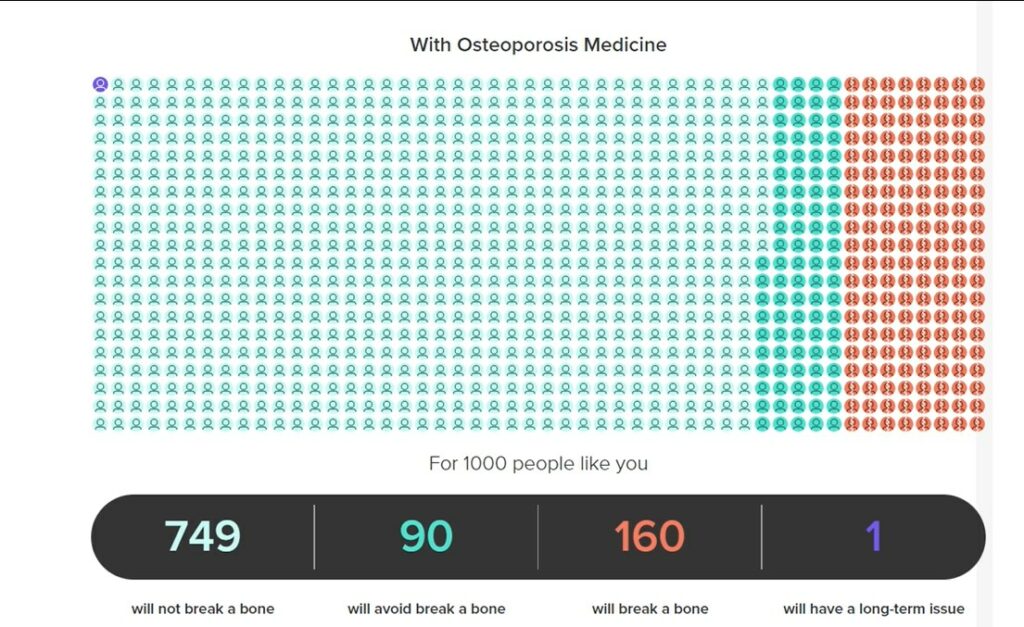
Cates plots or icon arrays are visual ways of communicating risk
We need to remember 3 things when explaining these tools
-
1
To use numbers, not words or percentages
-
2
To use positive and negative framing
-
3
AND to explain we have no way of predicting the outcome for that patient
Let’s look at this example.
Click play on the video
Icon arrays can also contain larger numbers of individuals to display rarer risks.
Have a look at the Cates plot below and think about what you would say to a patient to explain the risk of benefits versus the risk of serious harms.

Click on the video to show this one being explained.
Click below to move onto
COMMUNICATING ABOUT OSTEOPOROSIS
